File:Timeline of weekly confirmed COVID-19 deaths in the United States.svg

Size of this PNG preview of this SVG file: 800 × 565 pixels. Other resolutions: 320 × 226 pixels | 640 × 452 pixels | 1,024 × 723 pixels | 1,280 × 904 pixels | 2,560 × 1,807 pixels.
Original file (SVG file, nominally 850 × 600 pixels, file size: 72 KB)
Summary
| Description |
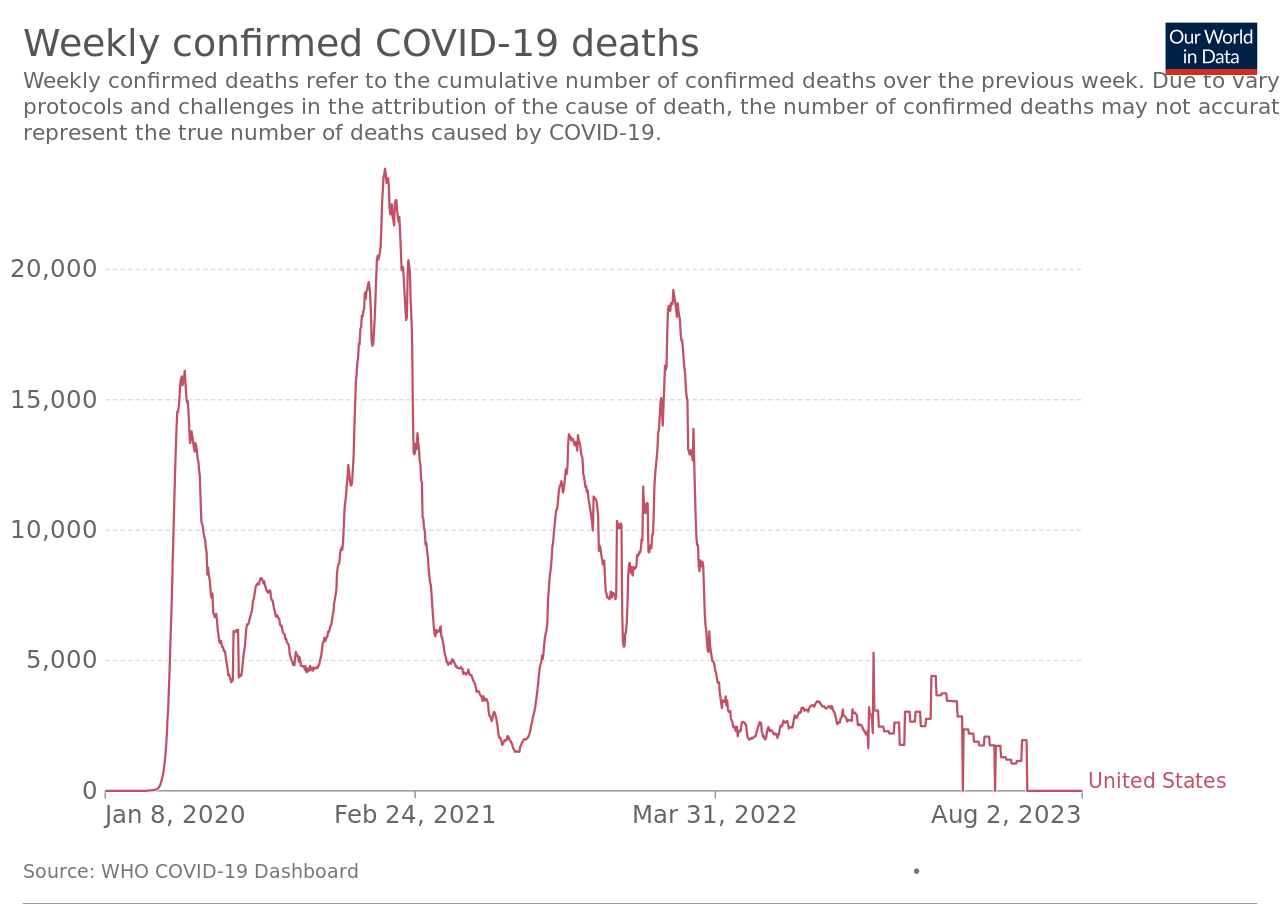
English: Timeline of weekly confirmed COVID-19 deaths in the United States. See end date on graph. Go to the source link below. The graph at the source is interactive and provides more detail. For example, run your cursor over the graph for the date and weekly count. The sources tab there links to: COVID-19 Data Repository by the Center for Systems Science and Engineering (CSSE) at Johns Hopkins University. The table tab has weekly numbers by country. |
| Date | is the date of the first upload to the Commons. See the file history below for the most recent upload date. Please upload new versions. Use the upload link at the end of the file history list. |
| Source | Own work using: https://ourworldindata.org/grapher/weekly-covid-deaths?tab=chart&country=~USA - Click on the download tab. |
| Author | Our World In Data. See Wikipedia: Our World in Data. |
| SVG development | This W3C-invalid vector image was created with an unknown SVG tool. This file uses translateable embedded text. |
Licensing
This file is licensed under the Creative Commons Attribution 4.0 International license.
- You are free:
- to share – to copy, distribute and transmit the work
- to remix – to adapt the work
- Under the following conditions:
- attribution – You must give appropriate credit, provide a link to the license, and indicate if changes were made. You may do so in any reasonable manner, but not in any way that suggests the licensor endorses you or your use.
File history
Click on a date/time to view the file as it appeared at that time.
| Date/Time | Thumbnail | Dimensions | User | Comment | |
|---|---|---|---|---|---|
| current | 21:58, 8 August 2023 | | 850 × 600 (72 KB) | wikimediacommons>Timeshifter | latest |
File usage
The following page uses this file: